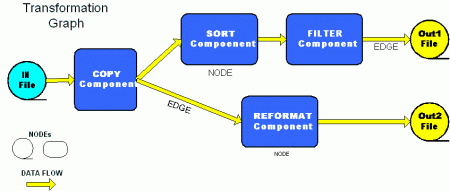
Transformation graph describes
how to transform data from one form to another. Graph consists at least
three elements, Nodes (perform various simple transformations), Edges
(connect Nodes and pass data around) and Metadata (describe data structure
that is defined at every Nodes and Edges).
The input to the transformation process are Input Nodes (those which
have no Edges comming into). On the other side, there are Output Nodes
storing results of transformation for example into data files, or database.

Example of transformation graph
2 - Nodes (or Components)
Nodes (or Components) are most important elements of graph. They can read, write or transform data from one form to another, every component has some input or output ports or both, component read or write data through them from to another component. If a component is initiative or terminated then has just input or output ports. Two components is connected by edge that is transmitting data in one direction from output port to input port and every edge has internal buffer that stores data.
- Node communicates through ports (Input ports and Output ports)
- Node peerforms "atomic" data transformation between set of input ports and output ports
- Node operates in vacuum (it has no knowledge about other components connected to it)
- Each port has associated metadata which describe structure of data coming from that port (if Input) or data which can be sent through port (Output)
- Every Component has :
- Two common parameters :
- Unique ID (composed of alphanum chars)
- Type (alphanum chars)
- Own parameters (for example) :
- Key
- url
- sqlQuery
- charset
- ...
Examples:
<Node id="Read feedburner feed" type="FEED_READER"
         url  = "http://feeds.feedburner.com/BurnThisRSS2"
         path = "channel"
/>
<Node id="Read CSV file" type="CSV_READER"
    url       = "http://www.abc.virginia.gov/Pricelist/text/disjan08.csv"
    quoted    = "true"
    delimiter = ","
    charset   = "ISO-8859-15"
    newline   = "\n"
    skiprows  = "5"
    maxrows   = "15"
/>
<Node id="Read from mysql table" type="SQL_READER"
         dsn = "mysql://root:root@127.0.0.1/information_schema"
    sqlQuery = "SELECT * FROM TABLES"
/>
More informations about XML Node definition can be found in Tag Reference (section <Node/>)
3 - Edges
Edges represent data flows between components in one direction. Edges between components are always bound to components ports. Components read data records from input ports and write them to their output ports.
Each Edge has associated metadata which describe structure of data
coming from that port (if Input) or data which can be sent through port
(Output)
Example :
<Edge from="Node 1" to="Node 2" metadata="mdata" />
More informations about XML Edge definition can be found in Tag Reference (section <Edge/>)
4 - Metadata
Metadata describes semantics of data record, this is how to create data record from elementary data types (string, date, integer, numeric, long, decimal, byte,..)
- Metadata describes structure of data
records:
- Name
- Type of record (fix-len, delimited)
- Additional text-formating information
- Individual data fields :
- Name
- Type
- Other specific properties (scale, length, etc.)
Example of metadata definition :
<Metadata>
    <DataRecord name="rss_metadata">
        <DataField name="link"                       type="string" />
        <DataField name="title"                      type="string" trim="true" />
        <DataField name="title" rename="description" type="string" trim="true" size="200"/>
    </DataRecord>
</Metadata>
More informations about XML Metadata definition can be found in Tag Reference (section <Metadata/>)
